Using knitractive with Python
Jeroen Janssens
2024-04-26
Source:vignettes/examples/python.Rmd
python.RmdView the corresponding python.Rmd file to learn more about how this page was generated.
In this example, we’re using the continuumio/anaconda3 docker image to run Python.
Python 3.11.7 (main, Dec 15 2023, 18:04:41) [GCC 11.2.0] on linux
Type "help", "copyright", "credits" or "license" for more information.
>>> import numpy as np
>>> import pandas as pd
>>> import matplotlib
>>>
>>> matplotlib.use('agg')
>>> pd.__version__
'2.1.4'
Because knitractive employs the tmuxr package under
the hood, the python session is maintained, and we can continue where we
left off.
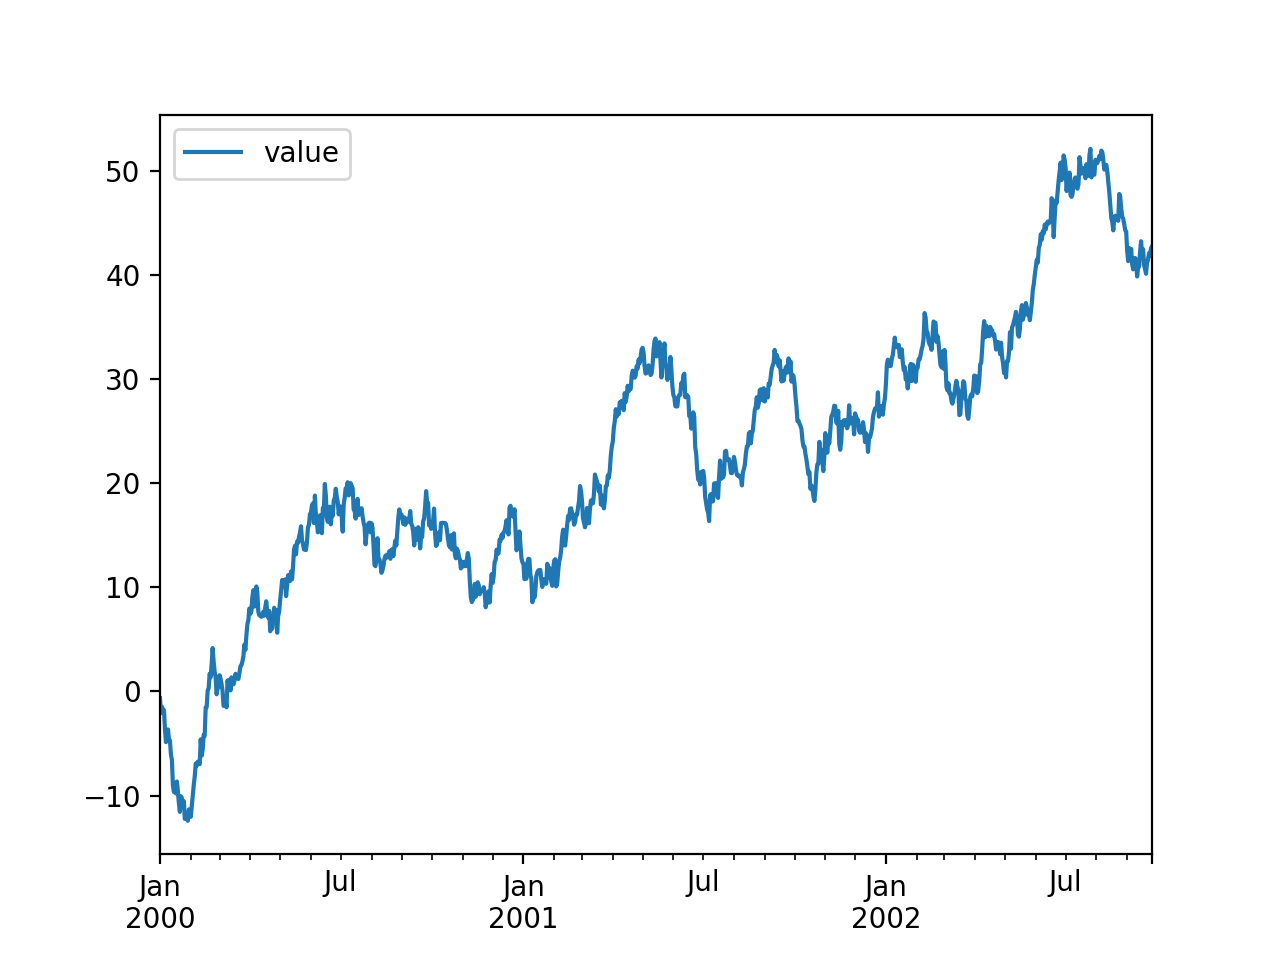
>>> ts = pd.DataFrame({"value": np.random.randn(1000)},
...                   index=pd.date_range('1/1/2000',
...                   periods=1000))
>>> ts = ts.cumsum()
>>> ts.head()| value | |
|---|---|
| 2000-01-01 | -0.646534 |
| 2000-01-02 | -2.089517 |
| 2000-01-03 | -1.474982 |
| 2000-01-04 | -1.744851 |
| 2000-01-05 | -1.800663 |
We’ve mapped the current working directory on the host to the
directory /data/ inside the docker container, so that we
can include generated figures.
View the corresponding python.Rmd file to learn more about how this page was generated.